12 things web developers should know about Firebug
Most web developers have heard of, and used Firebug, but perhaps don’t know its full power. Firebug is a debugger, editor, and monitor for websites, CSS, HTML, DOM, JavaScript, and HTTP. It was created by one of the original Firefox creators Joe Hewitt.
Below I will list 12 of the most important things I feel web developers should know about Firebug.
1. You can instantly find any part of the page’s HTML with Firebug
Have you ever used a background color property in HTML simply to see how big the element is? If so then you are wasting time.
After Firebug is installed simply right click on any place of any web page and select Inspect Element. This will instantly bring up the HTML inspector along with the styling information on the right hand side.
Once Firebug is open you can also click on the top left corner within Firebug, where the arrow is, and then use your mouse to hover over any part of the HTML page. Hovering over any HTML element will automatically highlight it for you in the actual HTML rendering.
2. You can modify HTML and CSS with Firebug
This includes editing HTML directly, adding attributes, removing elements, adding CSS styles, and more. When you change HTML the change will take place immediately on the rendered page.
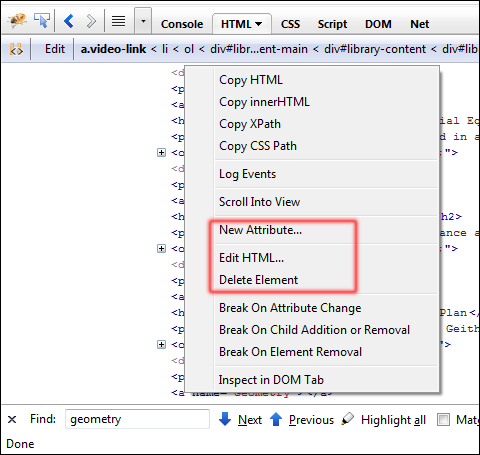
For bigger changes, you can even modify the entire HTML source at once instead of one element at a time.
3. You can discover what properties a DOM element has and work with XML
OK this one is actually two different items, but I messed up and put three twice :). Both features in #3 are independent though.
After inspecting an HTML element you can click on the right tab called DOM and see a list of every property available to you in JavaScript to iterate over the DOM. You can also go to the JavaScript editor and use the auto complete by typing in any JavaScript code and pressing Tab to iterate over the DOM elements.
To work with XML, simply open up an XML file and right click on any element. Select inspect element. Right clicking on the element in Firebug will then allow you to copy out the XPath location of the selected element.
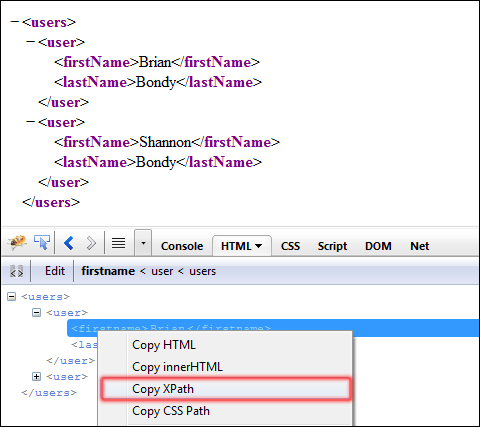
Of course this feature is also useful for HTML pages.
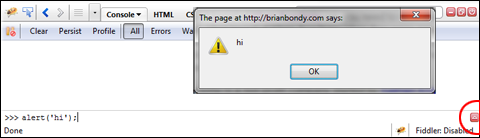
4.You can use Firebug to execute arbitrary JavaScript code
Want to execute new code within the context of the current page without reloading the current page?
With Firebug open, simply click on the Console tab.
You will see at the bottom of this window a prompt with 3 arrows:
>>>
These arrows allow you to type any arbitrary JavaScript code and execute it immediately.
There is a small red button on the bottom right which allows you to execute a multiline JavaScript code.
The JavaScript code even supports auto complete with all of the DOM elements that you are inspecting. Press Tab to iterate through (or Shift Tab) to go backwards.
5.Firebug remembers your state across reloads.
You can reload your page at any time and Firebug will automatically go back to the same part of the page it was at on the previous reload.
6.You can use Firebug to try things out easily.
You can use the JavaScript Console to execute code instantly and you have access to special variables like: \(1 the last element you inspected \)2 the 2nd last element you inspected
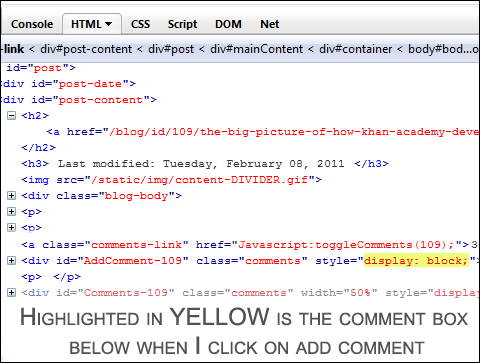
7. You can use Firebug to visualize how a page is changing state
Firebug will highlight any change in yellow as the change is happening. This is useful to visualize how the DOM changes after the page is loaded.
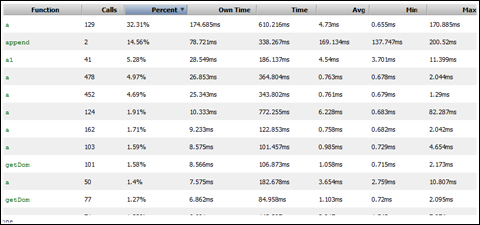
8. Profile your JavaScript code
With Firebug profiling you can start the profiler, and then do any operation including a page reload, and then stop the profiler.
On the Console tab simply click on the profile button, and then do whatever you want to measure, and when you are done hit the same button again.
This will create an absolutely awesome list of functions, the amount of calls to each function, The percent of time spent in that function, and the min, max, and average time spent in each function.
9. Profiling the rest of your web app
For a breakdown of the entire page load time, you can click on the top level Net tab in Firebug. It will show you a graphical display of how long each HTTP request took and the size of each response.
You can even expand each of these requests and see the request HTTP headers, the response HTTP headers, the actual response, and caching information. Looking at the response headers would be useful for example to see if compression was used to send your resource as the content encoding.
You can filter this list on the toolbar just under the Net tab and select to only view HTML, CSS, JS, or other types of files. You can for example filter on images and see just how much data is sent for images.
Even AJAX calls made after your page loads will automatically fill into this Net tab.
10. Logging one or more JavaScript functions
Every programmer knows that profiling is important, but just as important is logging so you can discover the sequence of calls in your program.
You can right click on any function name in the function definition in the script viewer and select to log the function. You can do this for several different functions, but the only time I can get the menu item to show up is when I right click the actual function name when the debugger is paused.
The console tab will then be filled with a message every time the log is called, and you can even see which parameter was passed in for each call. Once you have function logging turned on you can press F8 to run and watch the log tab fill in as you interact with the page.
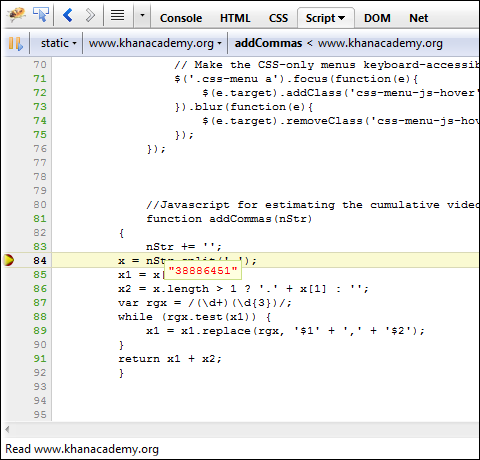
11. You can debug in Firebug
In the script tab simply click on the left of the line number you’d like to break on debugging and then reload your page.
- Press F10 to go to the next line.
- Press F8 to continue execution
- Press F11 to step into a function.
- Press Shift+F11 to step out of a function.
Other useful things you can do when debugging:
- Use the watch window to see any variable’s value while you are paused.
- Hover over any variable while the debugger is paused and see its value (as shown in the image above).
- When your debugger is paused, you can see the call stack. The call stack is shown in the toolbar at the top of Firebug, you can click on any item in the list to go to that source code for that function.
12. You can set conditional breakpoints in Firebug
Breaking every time a line is executed is usually best, but sometimes you know there is a bug only when a certain value occurs. You can then use conditional breakpoints to filter out when to actually break.
The following are some of the possibilities you can use with Firebug debugging:
- Break when a DOM element’s attribute change
- Break when a DOM element gets a child added or removed
- Break when a DOM element is removed
- Break when a certain condition is met, to do this simply right click on any breakpoint to see the conditional window.
- Break on errors, when an error happens it will show up on your console and you can then set a breakpoint next to it for the next time the error occurs.
Other Browsers?
Google Chrome offers a Firebug like tool which is included by default. You can right click on any element and select Inspect Element like in Firebug. Firebug also makes a lite version for Chrome which is not as good as the one for Firefox.
IE offers a tool called The IE Developers Toolbar.
Although both the built-in Chrome tool and IE Developer Toolbar are great tools, and can even do debugging, they are no match for Firebug+Firefox. Of course if you have a problem that only occurs in IE or Chrome you need to debug in IE or Chrome respectively.